

Introduction: Three Metrics, Five Years On, and a Lot of Out-of-Date Advice
If you last looked at your Core Web Vitals when they were the talk of every SEO conference, a fair amount has moved on. One of the three metrics has been replaced. Safari and Firefox can now measure two of them. Chrome has started measuring the page changes inside app-style websites that used to be invisible. And a wave of blog posts claims Google rewrote the rules in 2026, most of which doesn’t stand up when you check it against Google’s own documentation.
At the same time, the fundamentals are exactly where they were. There are still three metrics; the targets haven’t moved, and Google still describes them the same way: worth getting right, but no substitute for relevant, useful content.
This guide is the plain-English update for business owners and marketing managers. It’s the first supporting guide in our Technical SEO series, building on The Complete Technical SEO Checklist for 2027 and our BrightonSEO 2026 recap, Technical SEO in the Age of AI. We’ll cover:
- What the three Core Web Vitals measure, and the thresholds to aim for heading into 2027
- What has changed since you last looked, and what hasn’t
- What Google actually weighs now, in its own words
- Why fast, stable pages matter beyond rankings, including for AI search
- How to check your own scores for free
- Quick wins for each metric
What Are Core Web Vitals?
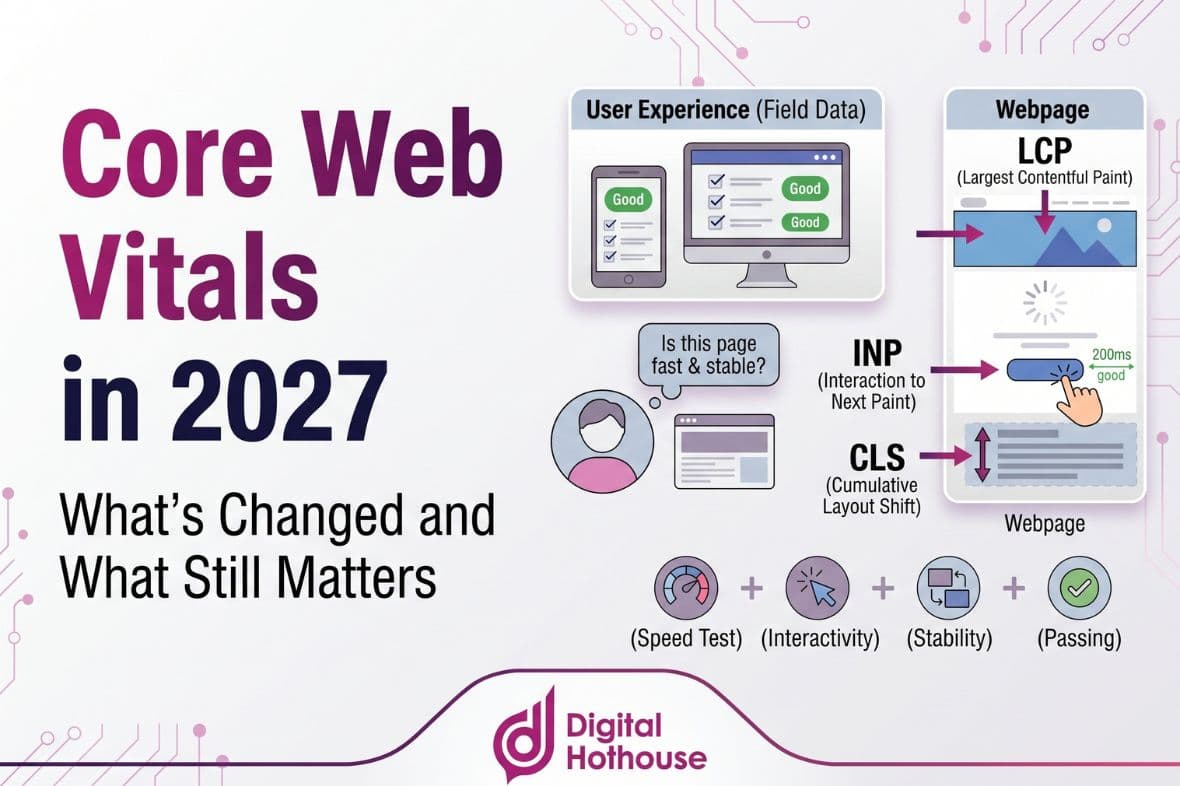
Core Web Vitals are three measurements Google uses to put a number on how a page feels to a real person: how quickly the main content appears, how quickly the page reacts when you tap or click, and whether things jump around while you’re trying to read. Google’s Search Central documentation describes them as metrics that measure real-world user experience for loading performance, interactivity and visual stability. They have been part of Google’s ranking systems since 2021.
These are the three metrics and the thresholds that apply heading into 2027, taken from Google’s Core Web Vitals report documentation:
| Metric | What it measures, in plain English | Good | Needs improvement | Poor |
| Largest Contentful Paint (LCP) | How long the biggest thing on screen, usually a hero image or headline, takes to appear | 2.5 seconds or less | Up to 4 seconds | Over 4 seconds |
| Interaction to Next Paint (INP) | How long the page takes to visibly respond after a tap, click or key press | 200 milliseconds or less | Up to 500 milliseconds | Over 500 milliseconds |
| Cumulative Layout Shift (CLS) | How much the layout moves unexpectedly while the page loads and is used | 0.1 or less | Up to 0.25 | Over 0.25 |
Three details catch people out:
- They’re measured on real visitors, not in a test. Google’s reports use the Chrome User Experience Report (CrUX), which collects anonymised data from real Chrome users over the previous 28 days. A single speed test on your office wifi tells you very little about this.
- The bar is three out of four visits. Each figure is the experience that 75% of visits met or beat. A page that is fast for most people but slow for a large minority on older phones or patchy mobile coverage can still fall short.
- Your weakest metric sets your status. Search Console labels a group of pages by its worst-performing metric, so a page with excellent loading speed and a poor layout shift score is still rated poor. Mobile and desktop are assessed separately.
What’s Changed Since You Last Looked
None of these changes moves the goalposts, but together they change what a good Core Web Vitals check looks like.
INP has fully replaced First Input Delay
If your last audit mentioned First Input Delay (FID), it’s out of date. Google replaced FID with Interaction to Next Paint on 12 March 2024, and FID has since been removed from Chrome’s tools altogether.
The difference matters. FID only looked at the delay before the very first interaction on a page, which made it a far easier test to pass. INP looks at every tap, click and key press across the whole visit and reports the slowest, ignoring outliers. It’s a much more honest test, and a harder one. At the time of the switch, Chrome’s own data showed 48.8% of websites passing with FID as the third metric, and only 45.6% with INP in its place.
More sites pass than ever, but responsiveness is slipping
The overall picture has improved since then. According to the Chrome UX Report release notes, 55.6% of websites had good Core Web Vitals in the August 2026 data, up from 45.6% when INP came in. Broken down by metric:
- 1% had good LCP, which makes loading speed the one most sites fail
- 5% had good CLS
- 3% had good INP
Two things are worth knowing behind those headline numbers. First, the INP figure has drifted down from 87.2% in March 2026, and the Chrome team describes the continued decline as a cause for concern, with no definitive explanation yet. Second, mobile is where most sites struggle. The 2025 Web Almanac, based on July 2025 data, found 48% of websites passing on mobile against 56% on desktop, and just 77% with good INP on mobile compared with 97% on desktop.
Put another way, more than four in ten websites still don’t pass. If yours does, you’re ahead of a large share of your competitors. If it doesn’t, you’re in plenty of company, and the fixes are well understood.
Safari and Firefox can now measure LCP and INP
For years, Core Web Vitals could only be measured in Chrome and browsers built on the same engine. That changed in December 2025. With the release of Safari 26.2, Google’s web.dev team confirmed that LCP and INP can now be measured in the latest version of every major browser.
This matters because visitors on iPhones and other Apple devices were previously missing from real-user performance data. A site could pass comfortably in Chrome and still be frustrating in Safari, with no way of seeing it.
There are three caveats:
- CLS still can’t be measured outside Chrome-based browsers.
- The browsers measure slightly differently, and DebugBear notes that Safari’s INP figures can still be unreliable.
- Google’s own dataset remains Chrome-only. Search Console and PageSpeed Insights will look the same as before. What’s new is what you can see in your own real-user monitoring tools.
Chrome can now measure app-style page changes
Many modern websites don’t load a fresh page when you click a link. They swap the content in place using JavaScript, which is common on sites built with frameworks such as React or Vue. Core Web Vitals have never handled this well, because they measured the first page load and then largely lost track of what happened next.
Chrome’s fix is called soft navigations. According to Chrome’s documentation, the feature is switched on by default from Chrome 151, and lets each in-app page change be measured for LCP, INP and CLS in its own right.
For now, this is a measurement improvement, not a ranking change. Chrome says it hasn’t yet decided how soft navigations will be reported in its public dataset, so it doesn’t currently alter what Search Console shows. If your site is built as a single-page app, it’s a good prompt to ask your developers how in-app navigation is being measured.
The tools have moved on too
A few of the tools you may remember have changed:
- The old CrUX Dashboard in Looker Studio was retired at the end of November 2025. Its replacement is CrUX Vis, a free tool that charts your site’s real-user data over time.
- PageSpeed Insights now shows the dates its real-user data covers, so you can tell whether a recent fix is reflected yet.
- Chrome’s tools now break LCP down into its component parts, which makes it much easier to see whether a slow score is caused by the server, the image or the page itself.
What Hasn’t Changed, Whatever You May Have Read
Search for Core Web Vitals advice today and you’ll quickly find confident claims that Google tightened the thresholds in 2026, that the March 2026 core update gave Core Web Vitals far more ranking weight, or that a “Core Web Vitals 2.0” has arrived with a new fourth metric.
We checked each of these against Google’s own sources, and none of them holds up:
- There are still three metrics. Google’s Core Web Vitals documentation lists LCP, INP and CLS, and nothing else.
- The thresholds are the same.5 seconds, 200 milliseconds and 0.1 are the same targets that applied when each metric was introduced.
- The March 2026 core update made no mention of Core Web Vitals. Google’s Search Status Dashboard entry records only that the update was released on 27 March 2026 and finished rolling out on 8 April. Google rarely explains what changes in a core update, which is exactly why specific claims about one deserve some scepticism.
- Google’s guidance on how much they matter reads the same. Its page experience documentation, last updated in September 2026, still describes Core Web Vitals as one consideration among many. We’ll come to that next.
That doesn’t mean Google will never add a metric or change a threshold. It replaced FID with INP, after all, and flagged the change the best part of a year in advance. But when a change does come, it will be announced by Google, not discovered by a blog. If you see a claim like this, look for a link to a Google source. If there isn’t one, treat it as speculation.
What Google Actually Weighs Now
The most reliable answer to “how much do Core Web Vitals matter for rankings?” is the one Google gives itself. Its page experience documentation is short, direct and worth reading in full. These are the points that matter most.
Core Web Vitals are used in ranking. Google states plainly that “Core Web Vitals are used by our ranking systems” and recommends that site owners achieve good scores.
There is no single page experience score. In Google’s words, “There is no single signal. Our core ranking systems look at a variety of signals that align with overall page experience.” Other aspects, such as HTTPS, mobile display and avoiding intrusive pop-ups, are worth getting right for visitors, but Google says they don’t directly help a page rank higher.
Relevance comes first. Google says it “always seeks to show the most relevant content, even if the page experience is sub-par”. Where lots of helpful pages compete for the same search, a great page experience “can contribute to success”. Our reading is that this makes Core Web Vitals closer to a tie-breaker between good pages than a way to lift a weak one.
Passing is the goal, not perfection. Google warns that good results in Search Console or third-party tools don’t guarantee top rankings, and that “trying to get a perfect score just for SEO reasons may not be the best use of your time”.
It’s judged mostly page by page. Google’s ranking systems generally evaluate content on a page-specific basis, with some site-wide assessments. That means your most important pages and templates deserve attention first.
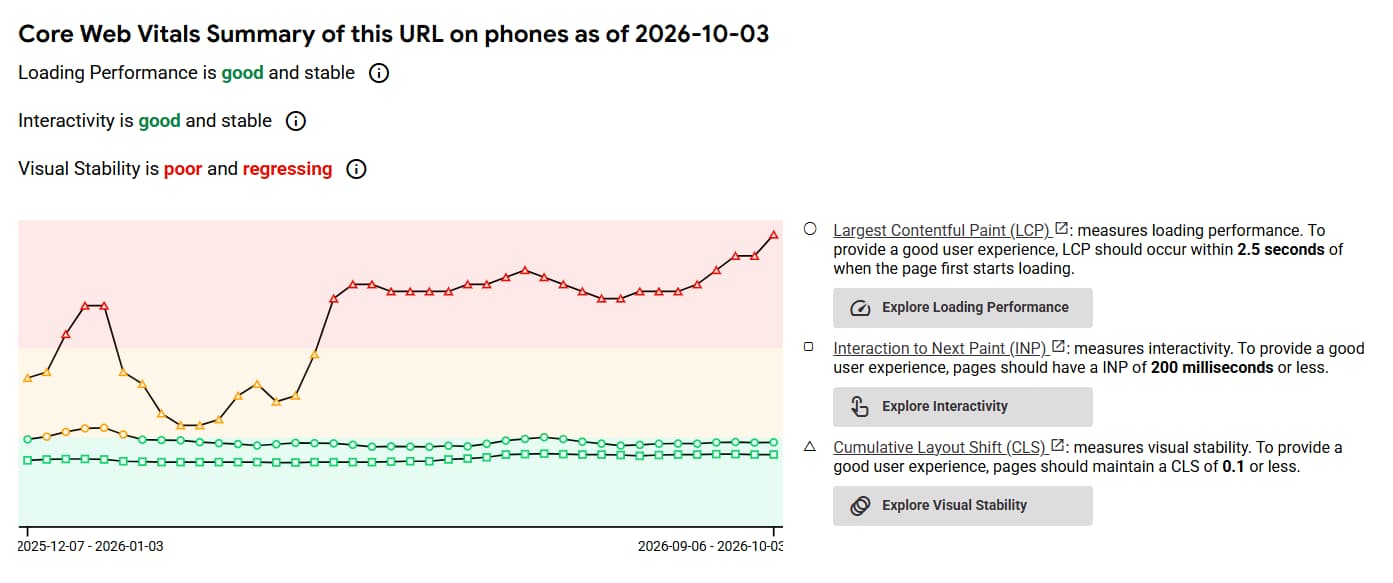
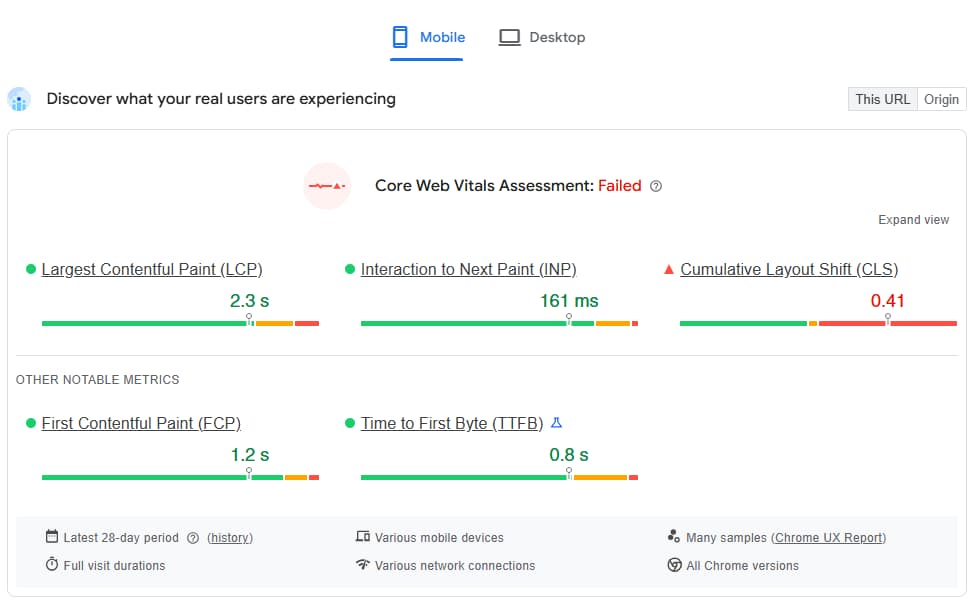
One more point clears up a lot of confusion. The 0 to 100 performance score in PageSpeed Insights comes from Lighthouse, a simulated lab test. It’s a useful diagnostic, but it isn’t a Core Web Vital. A page can score 60 in the lab and pass comfortably with real visitors, or score 95 and fail. Google explains why lab and field data differ in more detail. When the two disagree, the real-visitor data is the one to act on.
Paul’s take: “The question I get most often is whether Core Web Vitals still matter now that AI is answering so many searches. My answer is that they matter for the same reason they always did. A slow, jumpy page loses the customer, whoever sent them to it. The ranking benefit is a bonus on top of that, not the main reason to fix it.”
Why It Still Matters Beyond Rankings
If Core Web Vitals are closer to a tie-breaker than a trump card, it’s fair to ask whether they deserve the effort. We think they do, for two reasons that have little to do with where you rank.
Your customers feel it before Google does
Each metric describes a moment where a real person either stays or gives up: waiting for the page to appear, tapping a button that doesn’t respond, or hitting the wrong link because the page shifted under their thumb.
Google’s collection of Core Web Vitals business case studies puts numbers on this. Vodafone Italy improved LCP by 31% and recorded 8% more sales in A/B testing. iCook improved CLS by 15% and saw 10% more ad revenue. These are older examples from large brands, so treat them as an indication of direction, not a forecast for your own site. The principle scales down, though. With fewer clicks reaching websites than a few years ago, as we covered in How to Measure and Prove SEO ROI When Clicks Are Declining, each visit you do earn is worth more, and losing it to a slow page costs more.
AI search is built on the same foundations
Google is clear that there are no extra technical requirements for appearing in AI Overviews or AI Mode. Its guidance on AI features lists providing a great page experience among the existing SEO fundamentals that remain worthwhile, alongside crawlability, internal linking and making important content available as text.
The AI platforms beyond Google came up repeatedly at BrightonSEO 2026. In her session, Janaina Barreto-Romero of Oncrawl made the case that AI crawlers deprioritise slow and technically inaccessible pages, in much the same way that Google manages its crawl budget. We covered this in our BrightonSEO technical SEO recap.
It’s worth being precise about what that means. A crawler doesn’t tap buttons or notice a layout shift, so it never experiences INP or CLS the way a person does. What it does experience is how quickly your server responds and how heavy your pages are, and those are the same things that drag down LCP for human visitors. So the work overlaps heavily: a site that responds quickly and serves lean pages is easier for people to use and easier for any crawler to read. It isn’t a guarantee of being cited, but it removes one reason to be passed over.
How to Check Your Own Scores
You don’t need paid tools or a developer to find out where you stand. Three free Google tools cover it.
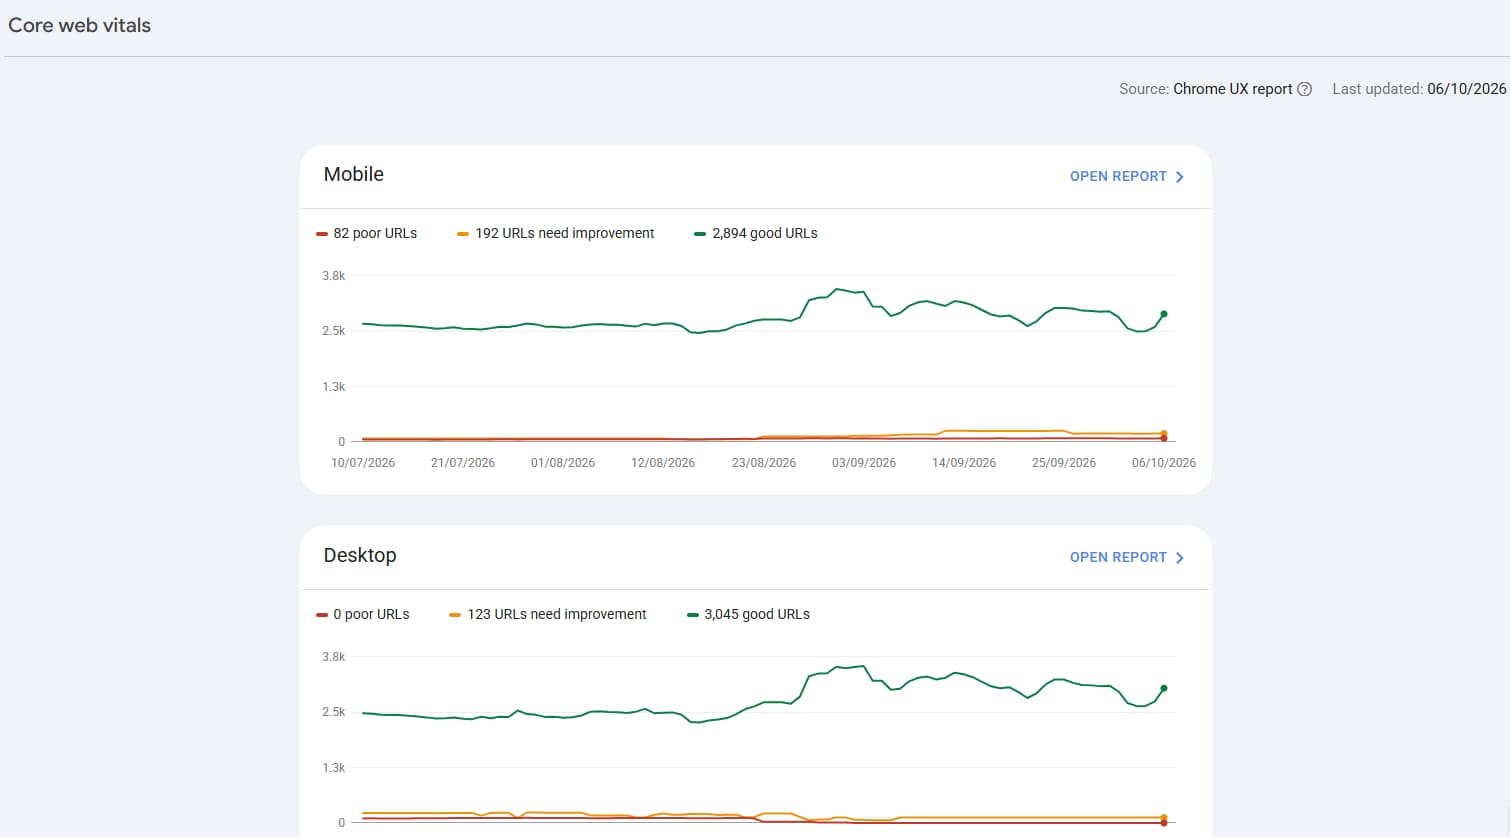
- Google Search Console. The Core Web Vitals report groups similar pages together and labels each group Good, Needs improvement or Poor, separately for mobile and desktop. Start here for the site-wide picture, and start with mobile.
- PageSpeed Insights. Enter any URL at pagespeed.web.dev. The top section, “Discover what your real users are experiencing”, shows the real-visitor data for the three metrics. The section below it is the lab test, with specific recommendations for that page.
- CrUX Vis.CrUX Vis charts your site’s real-visitor data over time, which is the easiest way to see whether things are improving or slipping.
A few things to keep in mind as you read the results:
- You may see “No data available”. Google only reports real-visitor data when a site or page has enough Chrome traffic. That can happen on smaller sites. If it does, use the lab results in PageSpeed Insights as your guide.
- Fixes take time to show. The data covers a rolling 28 days, so an improvement made today won’t be fully reflected for about four weeks.
- Check your key templates, not just the homepage. Product, service and blog pages often behave very differently from the homepage, and they’re often where visitors land from search.
- Fix “Poor” before “Needs improvement”. That’s Google’s own recommended order, prioritising the issues that affect the most pages or your most important ones.
We’ll walk through this process step by step in an upcoming guide in this series, Site Speed Audit: A Step-by-Step Guide for Non-Developers.
Quick Wins for Each Metric
The Chrome team publishes its own shortlist of the most effective ways to improve Core Web Vitals, chosen because they have the biggest real-world impact and are realistic for most sites. The quick wins below draw on that list and on the latest Web Almanac data. Some you can check yourself. Others are a short, specific request to pass to your developer.
LCP: get the main content on screen sooner
On most pages the largest element is an image. The 2025 Web Almanac found that 76% of mobile pages have an image as their LCP element, so that’s usually the place to start.
- Don’t lazy-load your hero image. Lazy loading is a good idea for images further down the page, but applied to the main image, it delays the very thing visitors are waiting for. Around 17% of mobile pages still do this.
- Tell the browser the hero image is a priority. Adding the fetchpriority=”high” attribute to that one image is a small change for a developer. Only about 17% of mobile pages with an LCP image use it.
- Serve a properly sized, modern image. JPG and PNG still account for more than 80% of LCP images. A correctly sized WebP or AVIF file is usually much smaller for the same quality.
- Look at hosting and caching. If the server is slow to respond, nothing else can start. Good caching and a content delivery network (CDN) can make a big difference for sites on budget hosting.
INP: make the page respond when people tap
Poor INP is usually a sign that the browser is busy running JavaScript when someone tries to interact. The Chrome team’s advice comes down to shipping less of it and breaking up what remains.
- Audit your tags. Open your tag manager and remove anything that’s no longer used: old tracking pixels, expired campaign tags, chat widgets nobody monitors. Google has specific best practices for tags and tag managers.
- Review plugins and apps. On WordPress and Shopify, every plugin or app can add scripts to every page. Remove the ones that aren’t earning their place.
- Delay what isn’t needed straight away. Ask your developer to load non-essential scripts after the page has become usable, and to break up long-running tasks so the browser can respond in between.
- Keep pages lean. Very long, complex pages take more work to update each time someone interacts. Simpler templates respond faster.
Paul’s take: “INP is the one that catches people out, because it rarely comes down to a single big fix. It’s usually the build-up of tags, widgets and plugins added over several years. An honest look at what’s still earning its place on the page is often the quickest route to a better score.”
CLS: stop the page jumping around
Most sites already pass CLS, and the fixes are usually the simplest.
- Give every image a width and height. Without them, the browser can’t reserve the right space and the page jumps when the image arrives. The 2025 Web Almanac found 62% of mobile pages have at least one image without set dimensions.
- Reserve space for anything that loads late. Ads, embedded videos, maps and review widgets should sit in a container that’s already the right size.
- Watch your banners. Cookie notices and promotional bars that push content down as they appear are a common cause. They should overlay the page or have space reserved for them.
- Load fonts carefully. When a custom font swaps in for a fallback, text can reflow. Google’s font best practices explain how to reduce it.
If you’re on Shopify or WordPress, the platform checklists in our Technical SEO Checklist for 2027 cover the most common causes on each.
Where to Go Next in This Series
Core Web Vitals are one layer of a technically healthy website. The Complete Technical SEO Checklist for 2027 sets out the full picture, including crawlability, JavaScript rendering, structured data and a 90-day action plan. If AI search is your main concern, The Complete Guide to Generative Engine Optimisation (GEO) is the place to start.
Over the coming months, we’ll be publishing more practical guides in the Technical SEO series, including:
- Crawlability & Indexability: Is Your Site Even Visible to Google and AI Bots?
- txt Explained: Should Your Website Have One?
- Site Speed Audit: A Step-by-Step Guide for Non-Developers
- Mobile-First Indexing: Common Mistakes Costing You Rankings
- Structured Data 101: The Schema Types Every Website Needs
- Technical SEO for Shopify Stores: The Complete Checklist
- Technical SEO for WordPress Sites: The Complete Checklist
- How Broken Internal Links Are Quietly Killing Your SEO
Follow us on LinkedIn so you never miss a post.
Find Out Where Your Site Actually Stands
Core Web Vitals in 2027 are less dramatic than the headlines suggest. The same three measurements, the same targets, and the same advice from Google: get them to good, then put your energy into being the most useful result. What has changed is how much more clearly you can now see the experience your real visitors are having, and how many of your competitors still haven’t fixed theirs.
Book a Technical SEO Health Check with Digital Hothouse. We’ll run an initial diagnostic crawl of your site, benchmark your key pages against the Core Web Vitals and crawlability standards that matter in 2027, and talk you through a prioritised list of what to fix first, not just a list of errors.
We’d love to work with you. Let’s chat.